Monday, May 13, 2013

GPS Data Collection


Introduction: This weeks activity was to go back to the Priory and collect data of the various features of the Priory. We first decided on the data we wanted to collect, then created the necessary data within ArcMap. We then used a Trimble Juno to collect the data.


Trimble Juno 3D.
Methodology: The first thing our group needed to do was to decide on the data that we wanted to collect. The Priory is a very wooded area with some dramatic topological changes. Some of initial idea was erosion points, significant trees, bench locations, trail locations, etc. We decided on trail locations. We were a little unsure what to expect, because when we were at the Priory in the winter, there was no real obvious trails. The snow was about 2 feet deep, so the trails blended in well with the surrounding landscape. The different Attributes we decided to record were Trail Use, Condition and Surface.

 
After deciding on our purpose we needed to create a geodatabase to store our GPS data. We were required to create a folder titled ‘CheckInOut_Username’, and then within that folder we needed to create a geodatabase named ‘Priory_username’. My username is petersct, so in place of username was petersct. We then had to create a feature class within the geodatabase based on the type of data we were collecting. We were collecting data on trails so we created a line feature class, in contrast to point or polygon. We were also required to set the projection to NAD_1983_HARN_Wisconsin_TM meters.

Now that we had the feature class created we needed to set the domains. The domains is the area where you set your data categories within the feature class. For example, I collected the data for Surface type. By different surface types were Pavement, Dirt and Gravel. By setting up your domains you are not required to type in the whole word while you are out in the field eliminating a lot of errors. We also created another domain for ‘Other’, which gave us an option if we ran into some unforeseen type of surface like Yellow Bricked.
Here is my collection of trail data.
All of the Trails put together from the group.
Conclusion: It was nice to go out to the Priory with no snow. It was also nice to actually be able to get out there and see everything that it has to offer. There were plenty of trails for us to find. I'm quite certain we were not able to get to all of the trails. I think our group got a good start on the trails for future reference. I thought this was a good exercise and gave me some experience with the Trimble unit.

High Altitude Balloon Launch

 
Introduction: A High Altitude Balloon Launch aka: HABL, is where you send the same weather balloon, as used in the previous Balloon mapping, but this time sending it into altitudes above 60,000 feet. There are a few different obstacles to tackle when sending something this high into the altitude.

Recap: Two things happen as you travel up through the atmosphere. The temperature drops dramatically and the air pressure lowers.
First the significance of the Temperature. Due to the extreme cold as you climb in altitude the camera must be secured so it does not freeze. Also as the air pressure drops the balloon will expand because the pressure within the balloon is greater than the outside pressure. Eventually causing the balloon to burst and fall back to earth.

Altitude above Sea Level Temp. (F) Pressure Air Density
5000 76.84 17.554 27.45
0 59 14.696 23.77
5000 41.17 12.228 20.48
10000 23.36 10.108 17.56
15000 5.55 8.297 14.96
20000 -12.26 6.759 12.67
25000 -30.05 5.461 10.66
30000 -47.83 4.373 8.91
35000 -65.61 3.468 7.38
40000 -69.7 2.73 5.87
45000 -69.7 2.149 4.62
50000 -69.7 1.692 3.64
60000 -69.7 1.049 2.26
70000 -67.42 0.651 1.39
80000 -61.98 0.406 0.86
90000 -56.54 0.255 0.56
100000 -51.1 0.162 0.33
150000 19.4 0.02 0.037
200000 -19.78 0.003 0.0053
250000 -88.77 0 0.00065

Methodology: We used a small styrofoam cooler to house the camera. This housing served a couple purposes, it would keep the camera warm and also help in protection of the camera once it fell back to earth. The camera was then secured into the cooler with a couple of heat pads to help keep the camera warm. We used the same type of heat pads that you would use for hunting or some outdoor activity in the winter.
Here is the class taking out the balloon for the launch.
This balloon was bigger than the one we used for the other aerial photography. The balloon was going further up in altitude and needed to be allowed some space for expansion. The camera rig was fastened onto the balloon as well as the GPS tracking device(so we could track the camera and retrieve) as well as a parachute for the descent. The above photo gives a good idea how big the balloon was, nearly 8' in diameter.
It was a fairly good day for the launch. The wind was out of the west so the balloon immediatly took off to the east.
One of the first still photos made. You are looking at UWEC campus.

Here is a great still photo made by the camera at some higher altitudes.


This photo shows that the balloon is probably reaching it's maximum altitude. Seems you are starting to see space in the upper left hand corner.

Finally the camera falls back to earth and we are lucky enough to get a signal from our GPS device and able to go and retreive it.
There it is stuck in the tree.
And, Dr. Hupy doing some climbing.
Here is the whole contraption. The orange cooler holding the camers, the tannish balloon and the blue parachute. 
 
As seen in the map above, the balloon took a ESE(East Southeast) path from Eau Claire.The balloon eventually travelled nearly 80 miles!
 
http://desi.uwec.edu/Geography/Hupyjp/Weather_Balloon_1024.asx Here is a video of the launch from earth.
 
Conclusion: I think this exercise was one of the coolest ones that we did. I think this would be a great way to teach any age group of a wide variety of subjects. You could teach geography, meteorolgy, atmosphere, etc.


Aerial Photo Mosiacing

Introduction: With all of the data from our Balloon mapping, the photos needed to be put into a mosiac. Instead of using a free program off of the internet, I used ArcGIS this time around. ArcGIS offers more flexibility in photo manipulation as well as allowing you to georeference with control points.


Methodology: While some students flew the balloon over campus some others took out a GPS unit to record some control points. The control points serve as a reference point on the land scape that allows you to georeference your photos. The control points are recorded at points that can be seen from satellite imagery. The idea is if the control point is suppose to be at a light post, you can georeference your photo to that light post. Besides lining up sidewalks, roads and building, the control points give you one more tool to align photos up to an existing background.
Control points

With such a large area to mosiac, the class also split the University up into smaller areas to be mosaiced by groups of three.
Area to be mosiaced

With my little experience in mosiacing, I gave my best shot at getting the photos lined up.
Here is the same map with my first picture mosaic.
And my second picture.
Discussion: The most difficult part of this exercise was to work with the different angles that the camera took. Even on the calm day that we had for the second balloon launch, there are still angles that you have to deal with especially with buildings. Also with over 5000 photos to choose from, it can be rather dull looking through all of the photos and trying to find one that doesn't have too dramatic angles.

Conclusion: Once again this was an interesting exercise. This would be a good way to get some detailed photos of a piece of property for planning, etc. I enjoyed this exercise and it gave me some more time to work with ArcMAP. It was also interesting to see how much has changed at the University with all of the construction.

Thursday, April 18, 2013

Balloon Mapping II

Introduction: This is part 2 of the Balloon Mapping project that was started in Exercise 3, or Balloon Mapping I of this blog. In part 1 we designed and tested various ideas for the Balloon Mapping as well as the HABL(High Altitude Balloon Launch). Now it was time to use our ideas to launch a balloon to do take some images of the campus.

Methodology: Due to the fact that there needed to be different tasks completed to make the launch happen, the class was split into different groups. Some were put in charge to fill the balloon, some needed to measure out 50 foot lengths on our balloon string, a videographer and photographer.
We measured out 50 foot sections of the string that would be holding the balloon. Our goal was to have the balloon 400 feet up into the air. Though, as you will later see, the wind did not allow the balloon to get that high.
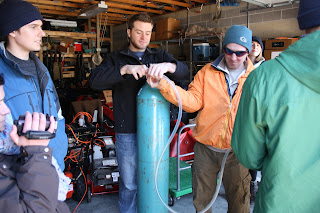
Helium tank
Starting to fill up balloon


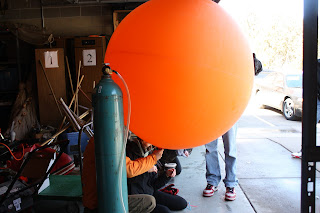
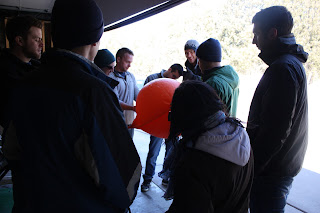
It's getting bigger!

On our way to let the balloon go.

 We attached a GPS unit to the balloon to record a Tracklog of where the balloon had been.
Dr. Hupy is seen here attaching the GPS unit to the balloon. You can also see the little styrofoam container that housed the camera.

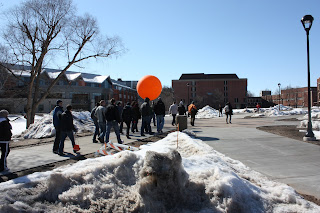
Of course, on the day of the launch, the weather was not cooperating much. It was about 30 degrees and very windy. The picture below does a good job showing how much of an angle the balloon was at in regards to where we were standing. Thus, dramatically lowering the altitude we hoped to get the balloon up to.
After the initial launch we decided to go back in and fill the balloon again, but with more helium, hoping that we could get more elevation despite the strong wind.

The second time we used both the camera and video camera.
Adding more helium to the balloon seemed to help. But, the wind was still strong and quite gusty at times. Regardless, we decided to take a walk around campus and even over the bridge that crosses the Chippewa River. When we got across the river we started to notice that the balloon seemed to be losing air. And then it all went down hill from there. The styrofoam box holding the camera actually fell from the balloon plummeting down into the icy cold Chippewa River. Luckily, prior to the second launch we decided not to attach the GPS because we did not wanted the added weight, otherwise I think we would have been down a GPS.

The video above shows not only the camera falling into the river, but it also shows how windy it was. The camera apparatus can be seen violently moving around.
Now, the whole point of sending a camera and a video camera 400 feet up into the air was to take photos and video of the surrounding landscape. The video is pretty straight forward.

But the photos needed to be mosiaced to try and come up with an image of the university grounds.
For those that are unfamiliar with what a mosiac is, it is an assemblage of smaller images to create one large image.

Mosiacing:
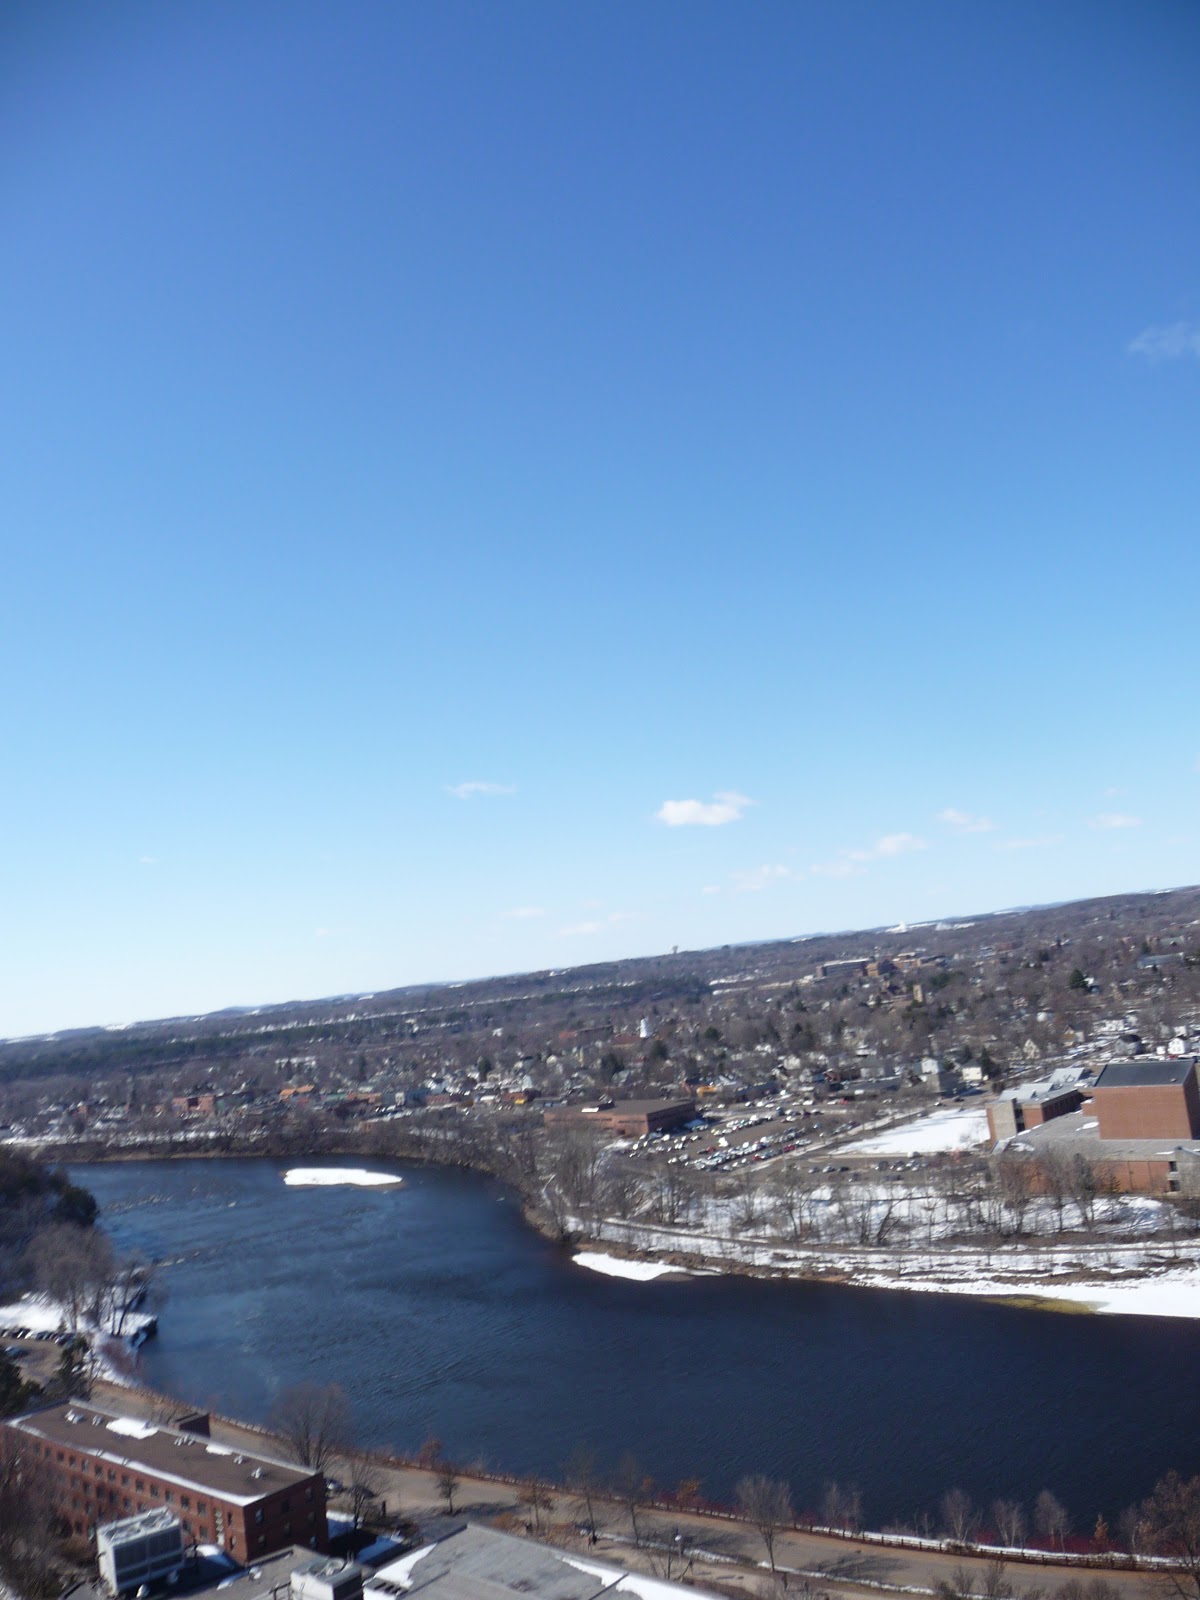
As seen in the video above, the wind really affected the quality of photos/video taken. A lot of the photos were of the horizon, not the ground. And the ones of the ground were not taken with the camera at a 90 degree angle to the ground. Here are some examples.
The photo above is not really the horizon, but it is pretty useless when trying to use it for mosiacing.
The beautiful Horizon.

With my limited experience in creating a mosiac, map creation in general and the distorted images, I tried my best to come up with a mosiac.

Nice huh?
Image of the area I was trying to Mosaic


Discussion: Once again this was a good experience. The weather was frustrating and luckily it only cost us a balloon and not a camera.

Conclusion: Well the weather really effected how everything turned out. The mosaicing was extremely difficult. Obviously  it would be better to do it on a nice day, but with everybodies schedule it would be difficult to reschedule. But, this experience gave us ideas no how to do it differently next time.

Wednesday, April 17, 2013

Navigation with GPS and Map

Introduction: This weeks activity was a continuation of the last three weeks. This time we were to track down all the flags with the help of a GPS and our map. But, there was  new twist, everybody was armed with paintball guns. Everybody was split into their teams of three once again, but we were not given a certain course, or set of flags, that we were to set out and find. This time we were to find all of the flags in any order we so choose. The only determining factor for which flags we should find first was to try and steer clear of other groups and their paintball guns.

Methodology: The first thing that we had to do was to update our existing maps. We had to add all of the flag points as well as the no shooting zones. Once again this was at the Priory, which is a public place and has a day care.
Updated map with the No Shooting Zone as well as all the Waypoints(flags)
Now that we had the map all ready to go, it was time to head over to the Priory and get our weapons and analyze the map to see what our best route would be. There were also some simple rules. We had 5 minutes to get to our starting piont with no shooting. If someone was shot in your team you had to wait 2 minutes in the spot of being hit. Also, obvious safety issues like don't shoot at somebody with no mask on and in general don't be cruel.

Choose your weapon.
Snowshoes were supplied, but were optional.
 
Ready to go.
Punch card for proving we reached that specific flag.
The waypoint flag with the punch hanging below.

We all picked out a gun and face mask and we all chose to wear snow shoes. The last time we were out here the snow was about 2 feet deep and pretty exhuasting to walk through. My one concern was walking through brush with the snow shoes, but they proved to be a life saver.
Once we were all dressed and ready to go we analyzed the map and tried to chose an efficeint route that would limit walking distance as well as an initial shoot out. I can't speak for everybody, but I was ok with not getting hit with paintballs right away..
The goal was to get to each coursepoint, punch our card, record a waypoint on our GPS and be the first to hit each coursepoint and return to the starting point.
We chose to start in the southwest corner at waypoint #2. We then worked our way around the largest no shooting zone in a kind of backwards C direction.
Map with the course points labeled.
We eventually ended up over by waypoint 14 at the end.
 
 
The map above shows my tracklog from my GPS and also each waypoint I took.

We were not able to make each course point due to time. With other teams shooting at us, it probably slowed us down by about 45 minutes to 1 hour.
Final map our whole groups Tracklogs and Waypoints.
 
 
Discussion: From the looking at the groups tracklog we stayed pretty much on direct routes to each flag. We relied on our maps heavily and only used the GPS tracking if we were unsure that we were heading in the right direction. The contour lines n our map proved to be absolutly priceless when trying to get a bearing on where we were at. We did have two skirmishes with two groups, this can be seen by the two spots were many tracklog points are consolidated together. Points 3 and 12 as seen below.


Conclusion: I thought this was fun and creative way to put together everything we have learned about navigating. I was able to get some more hands on experience with GPS devices. I was also able to implement UTM coordinate systems in a real life situation. While out on this exercise, I could not help but think what it must be like to actually be out in some hellish terrain while being shot at with real bullets. It was exhausting enough navigating through brush and steep elevation changes, to have somebody trying to kill you while doing so must truly be a nightmare.
I know that the point of this exercise was to navigate, but it would have been fun to be in a smaller area, so the 'fighting' would be a little more intense.
 

Monday, April 1, 2013

GPS Navigation

Introduction: For this exercise we had to navigate to 6 new points using only GPS Devices. Using only latitude and longitude as our guide, compass' and maps prove to be a very important tool. The points that we navigated to were also new, giving us a new terrain and area that we were unfamiliar with.


List of Latitude/Longitude Points.

The 18 points on the paper above are separated into 3 courses, 6 points to each course. Each group is given a course to follow. This week we had points 1-6.

GPS unit used, along with coordinates.
 

Methodology:

Differing from using a compass and map, using only GPS coordinates to navigate terrain proved to be quite difficult. Besides the difficulty of making sure that we were headed in the correct latitude/longitude direction, there was about 2 feet of snow. Now if there was 2 feet of snow and you knew exactly what direction you needed to go, that would be difficult enough. When you have 2 feet of snow and you walk 20 yards to find out you are walking in the wrong direction, it can be quite frustrating. When I first created the image below I was quite surprised how my route actually looks quite simple. I remember the route being rather difficult and remember doing a lot of back tracking trying to get back in the right lat/long direction.


Chuck Peterson Route
Group Route
With the dramatic terrain at the Priory, I found myself wishing for a topography map more than a compass. For the most part, you can get a good bearing of where you are at in regards to elevations changes in this area.
Besides the difficulty of the snow, our group soon came up with a system. We split the responsibilities up between the three of us. One person concentrated on latitude, one on longitude and the last person checked on both lat/long and kept an eye out for the flag. With the foliage off of the trees, it gave us a good chance to spot the flag even though it was quite aways off. In fact, at one point later in the exercise we went to the wrong flag. It was a mistake due to fatigue and we got lazy and didn't even check our GPS to see if we were going in the right direction.

Discussion: This was a good exercise in the regards to comparing navigating with a GPS in contrast to using topology maps and a compass. As Dr. Hupy has repeated this semester you have to be able to adjust to technology breakdowns. Indeed, this was a good example of a situation wear the older technology would prove to be more useful.

Conclusion: I think this exercise really drove home the point of the importance of having various forms of navigation. With my limited experience with GPS device I can see their importance and usefulness. That being said, I can see that they are not a good stand alone navigation device.

Monday, March 11, 2013

Field Navigation

Introduction: This week we went out to the Priory to use our navigation maps that we created last week. The goal was to use the tools and methods that we practiced and learned the previous week.

Methods: The first thing that needed to be done was to plot the points given to us using the UTM grid coordinates.
The list of points needed to be plotted.
We were on Course 3, so we had to plot the last 6 points on the list above. The list gives a X and Y coordinate, so it was very simple plotting the points on the map. We simply lined up the X and Y coordinate and drew a X to mark the point. Two groups were on each course, so one group went from point 1 to 6 and we went from point 1 to 6 then 6 to 5 and so on back to 1. For measuring distance we simply took an edge of paper marked the distance markers from our navigation map. That gave us a make-shift ruler that had intervals of 20 meters.


Measuring distance between 2 points.


Image of just the grid.


We then had to take the azimuth with a compass. This was the first time I used a compass so it was something I had wanted to learn for some time. Here is a picture of the kind of compass we used so I can refer to it.
Example of the compass we used.

After marking the points on the navigation map, you align the compass on two points. The red arrow needs to point in the direction that you intend to walk. For example our measurement from point 1 to 6. You align the starting point(point1) at the bottom of the compass. You then point the arrow to point 6. While you are doing this your needle will continue to point to magnetic north. You then put the 'red in the shed', which means you turn you azimuth ring so the orienting arrow aligns with the magnetic needle.
Image of a compass with some technical terms for reference.
Taking a Azimuth reading.

Our points with Azimuth and Distance.
We had our points plotted, distance and azimuth reading so we are ready for the field. Our first point was a tree where we met on of Dr. Hupy's helpers, Al. Al helped us get started by just confirming we were pointed in the right direction. We set our compass to 350 degrees and stood so the red was in the shed. We all agreed on a medium sized pine tree to use as a land mark that we could walk and take a new reading. We all walked to the tree counting our paces. Once we got to the tree we decided to just send one person ahead so the two who stayed back could confirm they were staying somewhat on the Azimuth reading. Nick took the lead and set out to pace 100 meters. Once he got close to the 100 meters he called out saying he had found the flag for point 6.
The image above shows Nick going forward from our first meeting point at the pine tree. Tonya and I stayed back to be sure he stayed on the right course.

For the rest of our points we pretty much did the same thing.
1. We took the azimuth of the current point.
2a. Sent one person ahead to pace 100 meters while we stayed back to confirm they 'runner' was staying on track.
2b. If there was a good landmark in the azimuth direction we would all just go to that landmark and retake the azimuth reading.
3. Once the runner would reach their 100 meter position everybody would come ahead to discuss the position and discuss whether we agreed on the position. With the brush and difficult terrain, due to peaks and valleys in the landscape, it was easy to get off course from the starting point. Usually the person who stayed back at the starting point had a good idea whether we were off or not.
4. We would then take another azimuth reading and send a runner ahead.
5. Once the flag was found the runner would usually yell to let us know to come ahead.
The image above shows Nick and Tonya have found the first flag.

Discussion: For the most part our distances and azimuth readings were pretty good. We used the map surprisingly little. If we found a flag that was obviously on a peak or in a valley we would confirm with our topographic map. As for the aerial map, I don't remember looking at it one time. The aerial map would have worked nice because one of our readings brought us through an area that was planted with pine trees. But, for the most part I think our group felt pretty confident where we were,that we relied on our readings.
The steep terrain did make it difficult staying on a azimuth reading for 100 meters. Which is why Dr. Hupy suggested we keep one person back to confirm that the runner is staying on track. The somewhat deep snow and brush was a little less of a hindrance for keeping on track, but they were definitely annoying.

Conclusion: I think it would be fun to do something like this on a bigger scale. I think our group may have been a little careless at times by walking ahead too soon and not keeping a person back at the meeting point all the time. If we were doing this in a more deselot place with harder terrain and more acreage, we could find ourselves in some trouble. Making a mistake doing something like this could be a real pain, because it takes significant amount of energy to trudge through the woods with 12" of snow(not to mention prickly ash and buckthorn).
I did learn a lot from this activity, and unlike Calculus, I can see myself using this experience in the future. It's pretty amazing that somebody majoring in Ecology and an avid outdoors kind of guy, can get away with never using a compass until his senior year in college.